
Although existing high lift and high flow pump stations differ widely in configuration, purpose and operating context, recent client projects undertaken by Arup and InfoTiles have highlighted a common thread: concern over the future.
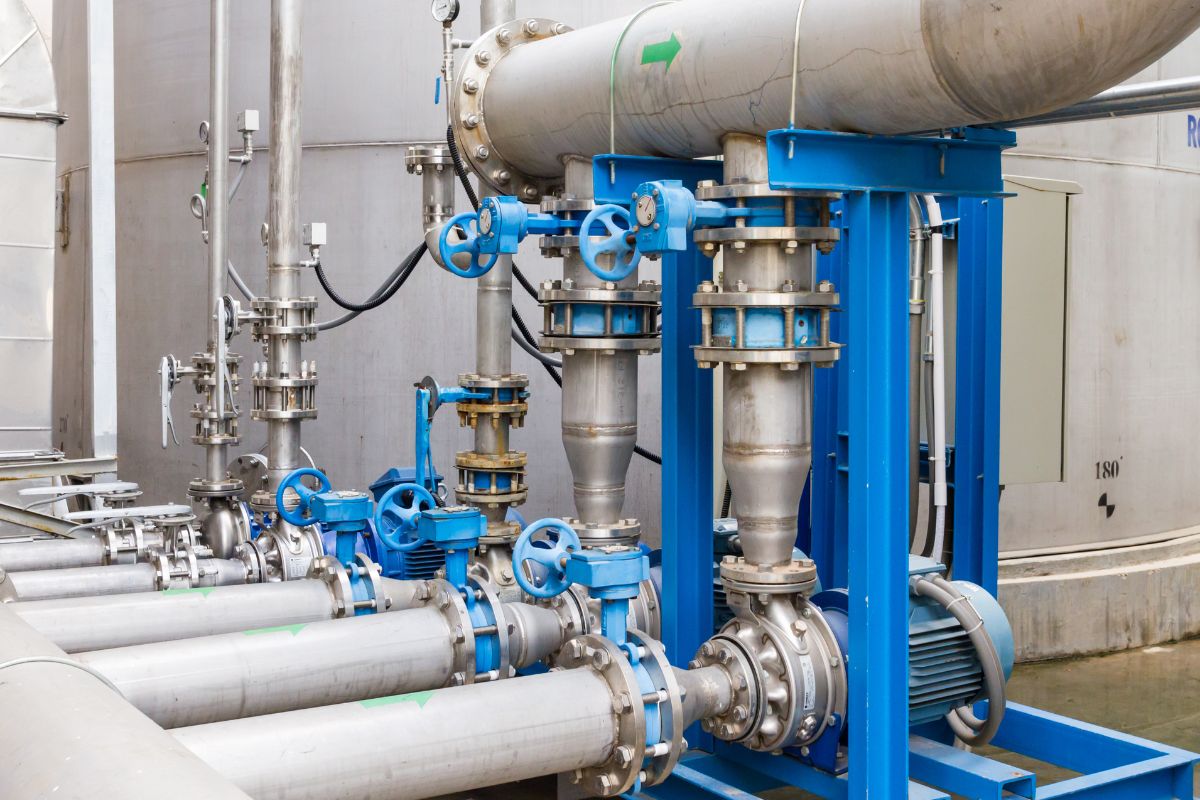
Pump station operators are being challenged to deliver a more resilient service with assets that have now reached, or in most cases exceeded, their initial design lives. Our clients are keeping pace with these ambitious targets through a combination of condition-based monitoring systems and highly skilled technical staff with deep domain and site-specific knowledge.
From our conversations, it is the second part of that partnership that is causing the most concern: the technical staff with a lifetime of experience in identifying issues, determining root causes and selecting the most appropriate solutions are retiring. Clients are working hard to find the next generation of staff to take over these roles but it’s a highly specialised field with a limited pool of resources to draw from.
Without a new generation of technically minded individuals in place to hand over to, there will be an inevitable loss of knowledge. The informal fixes, judgement calls and site-specific workarounds that keep assets running, risk leaving the organisation with the experienced operators who developed them.
The challenges associated with an ageing workforce, and the solutions required to address them, are complex and multifaceted. Whilst it doesn’t resolve the issue in isolation, one potential jigsaw piece is a change in approach to data accessibility, data manipulation and data interpretation.
At a high level, a large raw water transfer pump station will typically include some combination of the following assets: an intake arrangement, a low lift pump station, suction tanks, high lift pumps and a combined rising main. Across each of these assets, numerous instruments collect and transfer data back to central systems for storage. Devices range from level sensors in suction tanks, to vibration and temperature sensors on the pumps and motors, through to water quality instruments on the raw water inlet and flow and pressure monitoring on the rising main.
Even in this simplified system the number of data sources (and thus data points) quickly becomes large and unwieldy. Operators are left flicking between trend plots and alarm histories on HMI screens to determine whether the pumps are behaving as expected or, when they’re not, why they’re not.
Were the horizontal NDE pump bearing vibration levels really this high the last time the river water was this hot or is this the beginning of a problem? Is running the suction tank that low having a knock-on impact on vibration or can we keep going and extend run times? Are temperatures in the pump casing rising normally or has the temperature-time signature changed?
To seasoned operators the above questions pose challenges that are hard to solve with just the data available on site. Instead, they rely on their historic knowledge base to initially triage concerns before attempting to find points of comparison by scrolling back through time series. For less experienced operators however, there’s no portfolio of previous problems to reference making the task of focusing efforts in the right place extremely time intensive.
Over the past year, Arup and InfoTiles have been collaborating with Severn Trent Water on a proof of value project at one of their critical water supply assets. The project’s main aim was to demonstrate how historic and live operational data could be brought together in a structured, accessible platform to help operators identify anomalies, compare current performance with previous pump runs and make better-informed operational decisions.
The platform works by ingesting, structuring and then enriching raw operational data from site and presenting it back to users through three complementary dashboards. Each dashboard is developed to answer a different type of operational question: what is happening now, what factors may be influencing pump behaviour, and whether performance is changing over time.
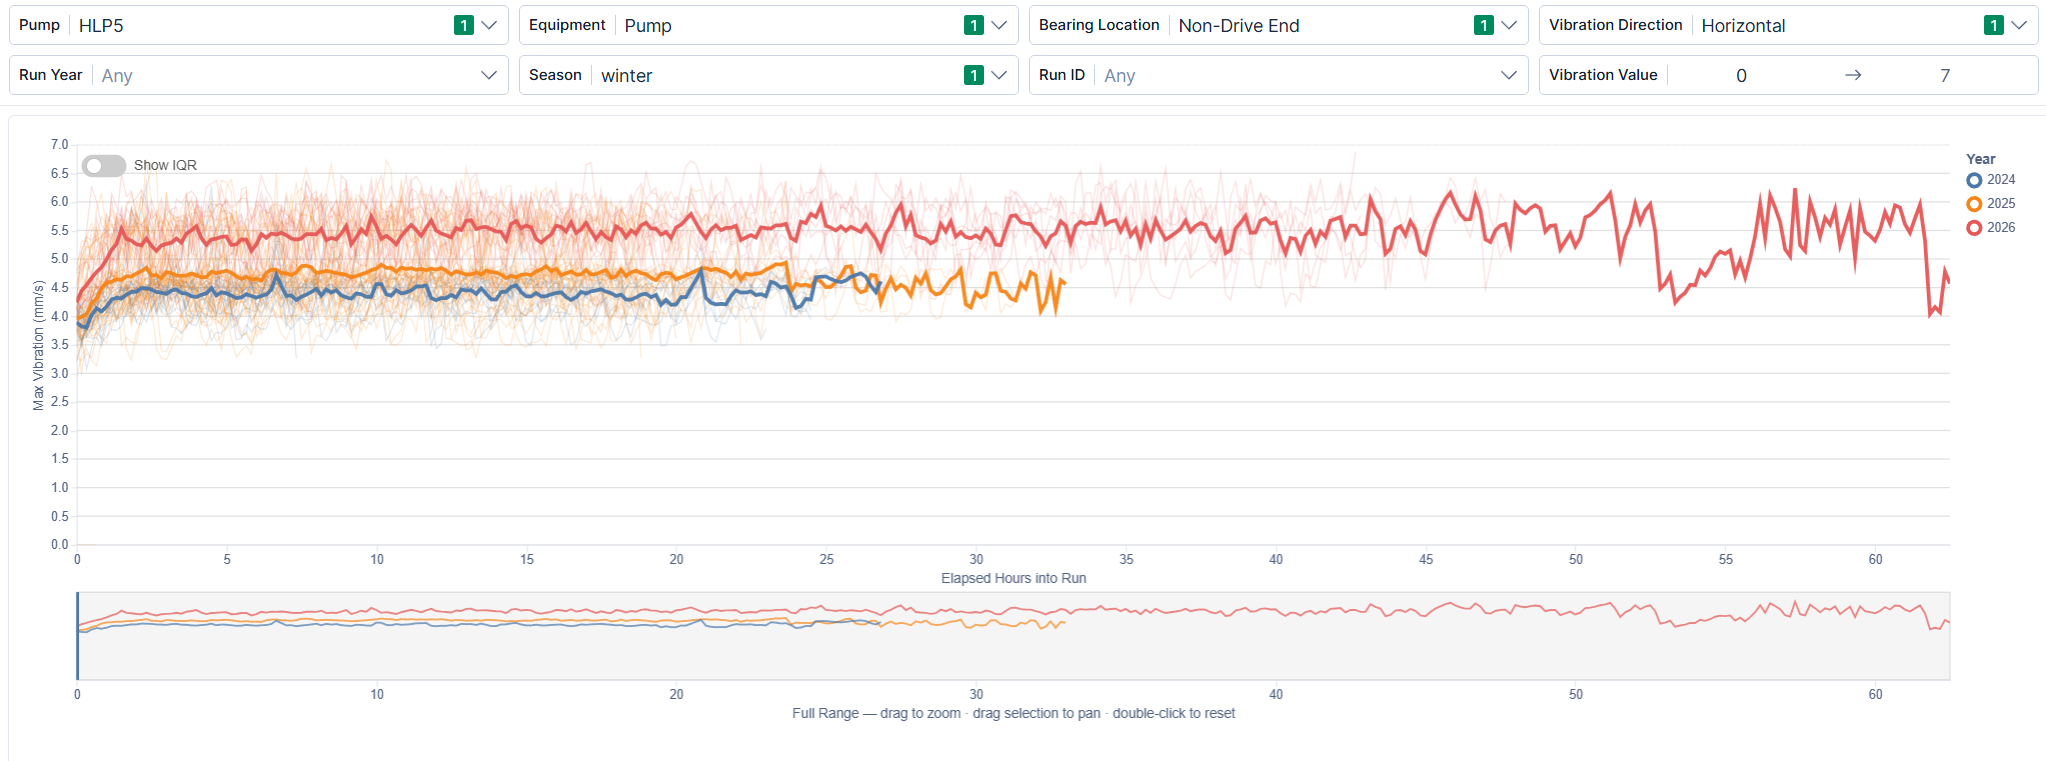
The first dashboard provides a time series view of pump station condition. It allows users to plot multiple filterable variables (pump vibration and temperatures, ambient conditions, river conditions, tank levels) against a selected time period and view the results on a single screen. Shorter time windows retain high-resolution data, while wider time windows are scaled to maintain dashboard performance and support a quick overview of maximum or average conditions. In practice, this enables local anomalies to be reviewed against wider operating context and helps operators decide whether observed behaviour is isolated, recurring or potentially linked to wider site conditions.
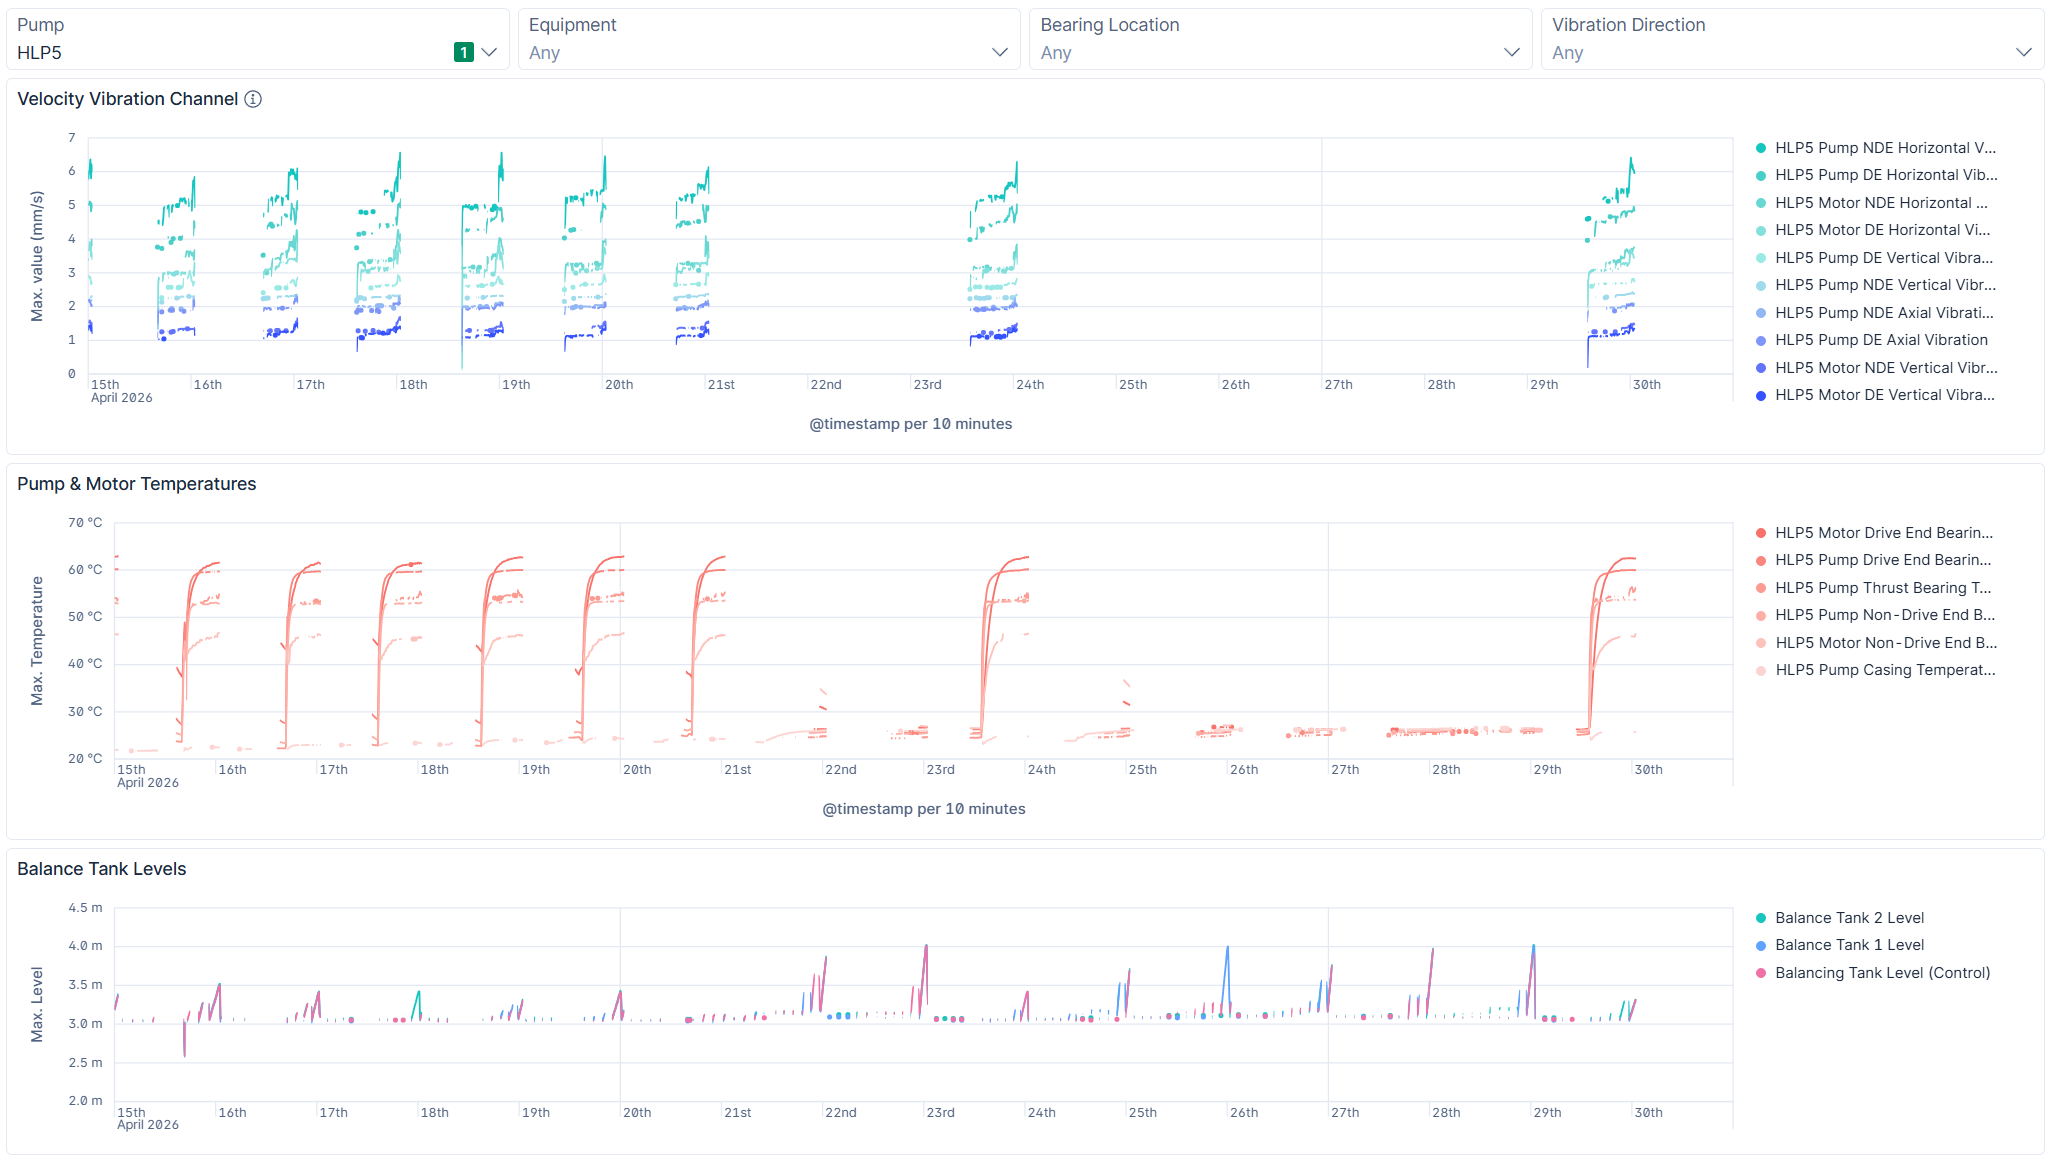
The second dashboard provides a correlation analysis view. Instead of plotting variables only against time, it allows selected pump and motor vibration data to be plotted directly against other operating or environmental variables, such as suction tank level or river temperature. This makes it possible to test commonly held operational assumptions/hypotheses, for example whether lower suction levels are associated with increased vibration, or whether vibration behaviour changes under different river temperature conditions.
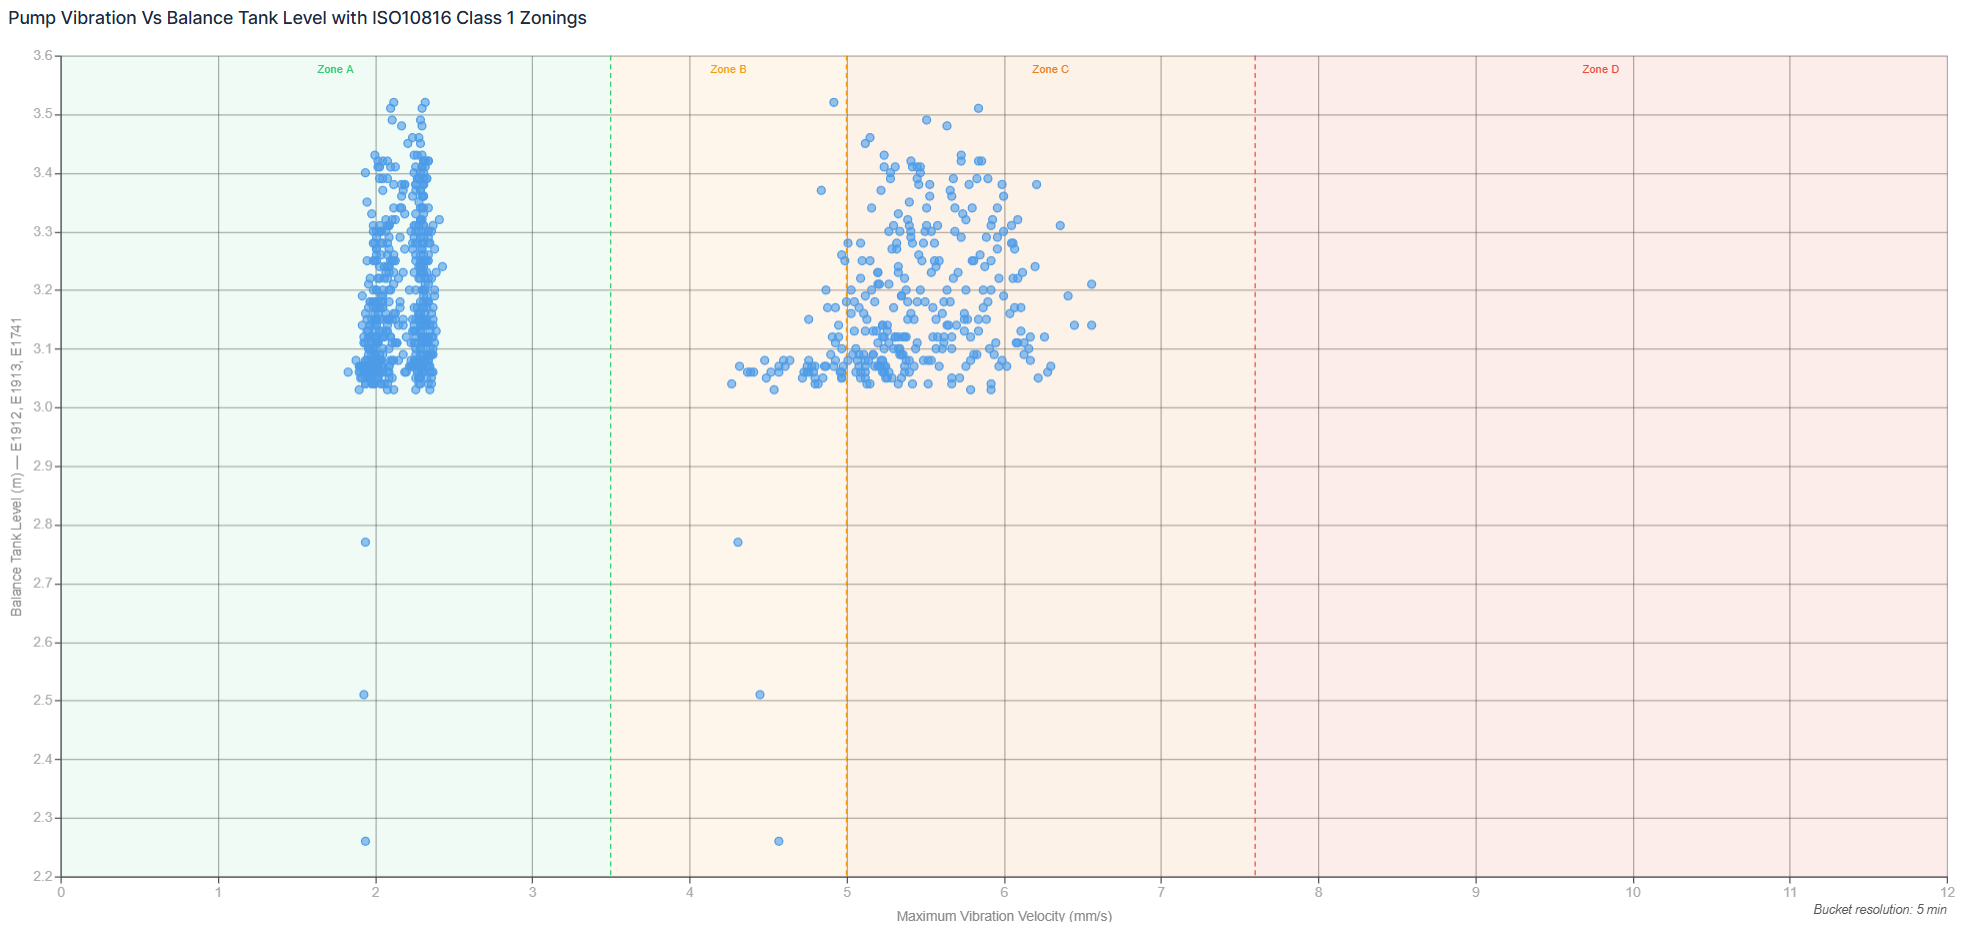
The third dashboard provides a degradation analysis view. This dashboard groups vibration data into individual pump run instances and allows users to compare performance across different years, sensors and seasons of operation. By plotting vibration against run hours and displaying mean and median values for each year at each minute of operation, the dashboard gives operators a quick way to determine whether a particular vibration signal is remaining broadly stable or degrading. The below image provides an example of this where a user is looking at the horizontal vibration levels at the pump NDE sensor. In this instance a user would be able to see degradation from one year to the next but also note that the rate of degradation is increasing year on year and that values in 2026 are above acceptable levels.
The value of the Arup InfoTiles approach is that it enables operational decisions to be rooted in historic asset performance without depending entirely on the presence of the experienced operator who holds that knowledge. Previous pump runs, operating conditions and abnormal events are made visible, searchable and comparable, giving less experienced users a more reliable basis for initial diagnosis. The platform does not replace the need for technical judgement; rather, it provides the contextual evidence required to apply that judgement more consistently. In doing so, it helps convert site-specific experience from individual memory into a more durable organisational knowledge base.
The wider opportunity is therefore a positive one. The water industry is facing a difficult transition as experienced operators retire, but it is also entering a period in which digital tools can help make operational knowledge more visible, transferable and enduring. By combining live telemetry, historic asset performance and engineering insight, the next generation of platforms can support more confident decision-making across complex pumped systems. Used well, these tools can help bridge the gap between past experience and future capability.
This latest project is part of a wider collaboration between Arup+InfoTiles and Severn Trent looking at how data can be leveraged to solve industry wide problems. For more information on what else we're doing, visit Arup.